Interface walkthrough
❗ Important: The documentation in this topic refers to a feature or product that is currently in Early Availability status. Features in Early Availability status are only available in production to a limited number of customers based on fit with specific use cases. For more information about Early Availability status, see Product lifecycle phases. If you would like to use the product capabilities described here during the Early Availability phase, contact your AppDirect technical representative.
AppInsights users have a tremendous amount of freedom in customizing the content and structure of their dashboards. As a new user, there are a number of key elements of the user interface that will be most important in getting your dashboards up and running.
AppInsights basic interface

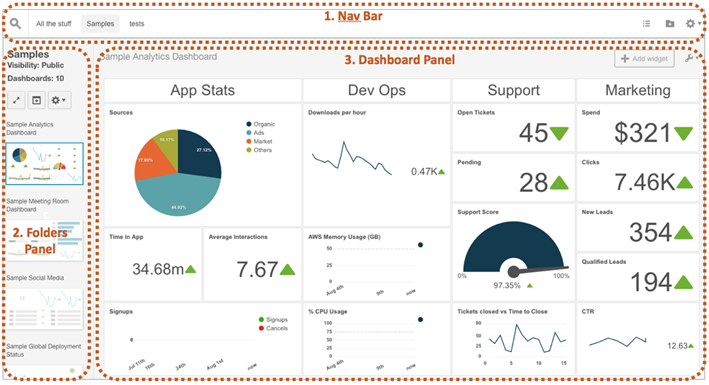
The interface is divided into three parts:
- Top navigation bar - Contains tools to help you create folders for your dashboard and make changes to your account level options.
- Folders panel - Folders are your main tools for organizing and managing your dashboards. Here you can find options for grouping different dashboards and sharing to different audiences.
- Dashboard panel - Where you put your visualizations, widgets, and customize individual dashboards.

The Nav Bar
The Nav Bar contains the Navigator, bookmarks to folders of dashboards, a button to create new folders, a button to re-order bookmarked folders, and an Account Tools dropdown.
The Navigator opens to a keyword search bar and can open directly to a dashboard. You can also drag dashboards directly to a folder in the Navigator. The Account Tools dropdown contains options that are applied account-wide. These include styling options, IP whitelisting, authentication management, and user permissions.

Folders panel
Folders are places to organize your data for particular audiences. The Folders panel consists of info about a particular folder, a folders toolbar, and thumbnails of the dashboards in that folder. You can reorder these thumbnails simply by drag and drop.
The buttons in the Folders toolbar will let you open a slideshow of the dashboards in the toolbar, add dashboards to the folder, and open a dropdown that contains folder specific options, like sharing a folder with others and deleting the folder.

Dashboard panel
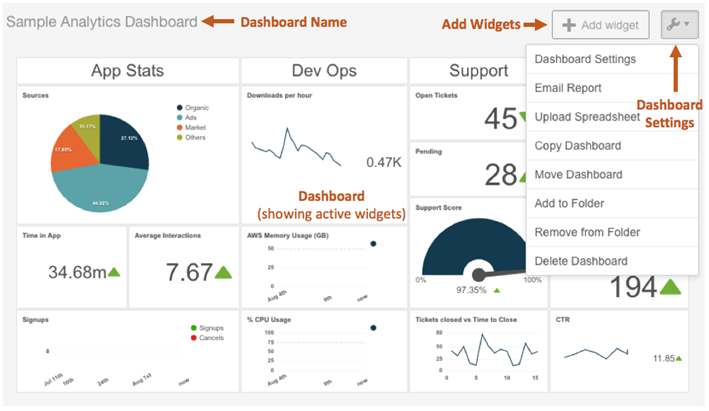
The dashboard is a collection of widgets. The dashboard panel contains the dashboard name, has a button to add widgets and a dropdown featuring dashboard specific options. These options include creating email reports of the dashboard, moving the dashboard, or deleting the dashboard.

Data Sources panel
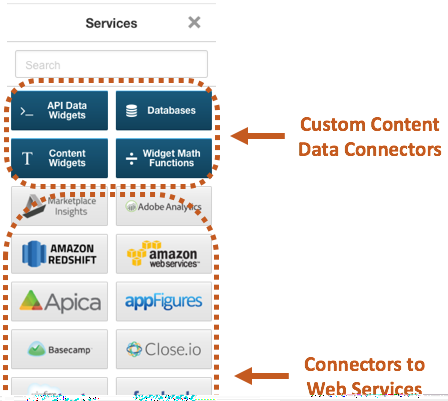
Clicking the add widget button will open the Data Sources panel so you can choose how to connect to your data. These are divided into two sections: custom sources like databases (Amazon RedShift, MySQL, and PostgreSQL), Google Sheets, and the AppInsights API, or web services like Google Analytics, Salesforce, and Facebook.

Widgets
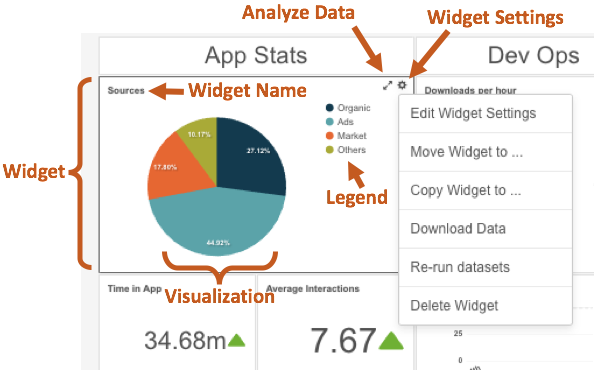
Widgets are the basic unit in AppInsights and display a specific piece of data that you are interested in. Each widget contains the widget name, an Analyze Data button that will zoom into the specific data in the widget, a widget settings dropdown that contains options specific to that widget type, and the visualized data and any associated legends and axes.
Was this page helpful?
Tell us more…
Help us improve our content. Responses are anonymous.
Thanks
We appreciate your feedback!